Correct Answer

verified
Correct Answer
verified
Multiple Choice
Almost all economists agree that tariffs and import quotas
A) reduces general economic welfare.
B) increases general economic welfare.
C) have no effect on general economic welfare.
D) stimulate a less than fully employed economy.
F) A) and C)
Correct Answer

verified
Correct Answer
verified
Multiple Choice
The argument that purchases of minivans cause large families is an example of
A) omitted variables.
B) normative statements.
C) reverse causality.
D) bias.
F) A) and B)
Correct Answer

verified
Correct Answer
verified
Multiple Choice
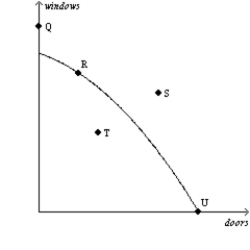
Figure 2-4  -Refer to Figure 2-4. This economy has the ability to produce at which point(s) ?
A) Q, R, T, U
B) R, T, U
C) R, U
D) T
F) A) and B)
Correct Answer

verified
Correct Answer
verified
Multiple Choice
The Federal Reserve
A) designs tax policy.
B) enforces the nation's antitrust laws.
C) sets the nation's monetary policy.
D) analyzes data on workers.
F) A) and B)
Correct Answer

verified
Correct Answer
verified
Multiple Choice
A demand curve shows the relationship
A) between income and quantity demanded.
B) between price and income.
C) between price and quantity demanded.
D) among income, price, and quantity demanded.
F) All of the above
Correct Answer

verified
Correct Answer
verified
Multiple Choice
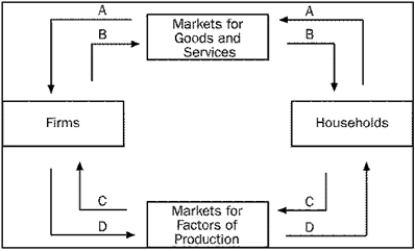
Figure 2-1  -Refer to Figure 2-1. Which arrow represents the flow of goods and services?
A) A
B) B
C) C
D) D
F) A) and C)
Correct Answer

verified
Correct Answer
verified
Multiple Choice
Policies such as rent control and trade barriers persist
A) because economists are about evenly divided as to the merits of those policies.
B) because almost all economists agree that those policies have no discernible economic effects.
C) because almost all economists agree that those policies are desirable.
D) despite the fact that almost all economists agree that those policies are undesirable.
F) All of the above
Correct Answer

verified
Correct Answer
verified
Multiple Choice
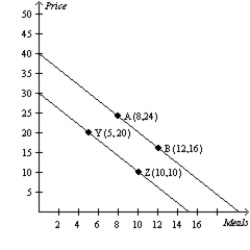
Figure 2-18
Relationship between Price and Restaurant Meals  -Refer to Figure 2-18. A movement from point A to point B is called
A) a shift in demand.
B) a movement along the demand curve.
C) a shift in supply.
D) a movement along the supply curve.
F) A) and B)
Correct Answer

verified
Correct Answer
verified
Multiple Choice
Economists view normative statements as
A) prescriptive, making a claim about how the world ought to be.
B) descriptive, making a claim about how the world is.
C) statements about the normal condition of the world.
D) pessimistic, putting the worst possible interpretation on things.
F) None of the above
Correct Answer

verified
Correct Answer
verified
Multiple Choice
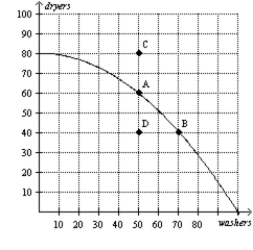
Figure 2-5  -Refer to Figure 2-5. The opportunity cost of this economy moving from point A to point B is
A) 20 dryers.
B) 20 washers.
C) 20 dryers and 20 washers.
D) 60 dryers.
F) B) and C)
Correct Answer

verified
Correct Answer
verified
Multiple Choice
The Economic Report of the President
A) discusses recent developments in the economy and presents analysis of current policy issues.
B) is written by the Council of Economic Advisers.
C) is the responsibility of the economists at the Office of Management and Budget.
D) Both a and b are correct.
F) A) and C)
Correct Answer

verified
Correct Answer
verified
Multiple Choice
Figure 2-2  -Refer to Figure 2-2. If households are buyers in the markets represented by Box C of this circular-flow diagram, then
A) Box C must represent the markets for the factors of production.
B) Box D must represent the markets for goods and services.
C) firms are sellers in the markets represented by Box C.
D) All of the above are correct.
F) A) and C)
Correct Answer

verified
Correct Answer
verified
True/False
A technological advance in the production of the first good increases the opportunity cost of the first good in terms of the second good.
B) False
Correct Answer

verified
Correct Answer
verified
Short Answer
Table 2-6  -Refer to Table 2-6. Consider the production possibilities table for an economy that produces only mobile phones and pizzas. Describe the shape of the production possibilities frontier.
Correct Answer

verified
Correct Answer
verified
Multiple Choice
Studying which of the following is helpful in learning to think like an economist?
A) theory.
B) case studies.
C) examples of economics in the news.
D) all of the above.
F) None of the above
Correct Answer

verified
Correct Answer
verified
True/False
An economic model can accurately explain how the economy is organized because it is designed to include, to the extent possible, all features of the real world.
B) False
Correct Answer

verified
Correct Answer
verified
True/False
A pie chart is a way to display information regarding two variables.
B) False
Correct Answer

verified
Correct Answer
verified
Multiple Choice
In the circular-flow diagram,
A) taxes flow from households to firms, and transfer payments flow from firms to households.
B) income payments flow from firms to households, and sales revenue flows from households to firms.
C) resources flow from firms to households, and goods and services flow from households to firms.
D) inputs and outputs flow in the same direction as the flow of dollars, from firms to households.
F) A) and C)
Correct Answer

verified
Correct Answer
verified
Short Answer
When economists are trying to explain the world, they are scientists. When they are trying to improve it, they are
Correct Answer

verified
Correct Answer
verified
Showing 521 - 540 of 645
Related Exams